 Web Server Statistics for NMITA
Program started at Tue-30-Apr-2013 16:43.
Analysed requests from Wed-01-Oct-2008 08:53 to Fri-31-Oct-2008 14:46 (30.25 days).
Web Server Statistics for NMITAProgram started at Tue-30-Apr-2013 16:43.
Analysed requests from Wed-01-Oct-2008 08:53 to Fri-31-Oct-2008 14:46 (30.25 days).
(Go To: Top | General Summary | Monthly Report | Weekly Report | Daily Report | Daily Summary | Hourly Report | Hourly Summary | Domain Report | Organisation Report | Host Report | Status Code Report | File Size Report | File Type Report | Directory Report | Failure Report | Request Report)
This report contains overall statistics.
Figures in parentheses refer to the 7-day period ending 31-Oct-2008 23:59.
Successful requests: 1,900 (135)
Average successful requests per day: 62 (19)
Logfile lines without status code: 3 (0)
Successful requests for pages: 201 (48)
Average successful requests for pages per day: 6 (6)
Failed requests: 723 (44)
Distinct files requested: 677 (89)
Distinct hosts served: 8 (2)
Data transferred: 25.89 megabytes (3.11 megabytes)
Average data transferred per day: 876.65 kilobytes (455.10 kilobytes)
(Go To: Top | General Summary | Monthly Report | Weekly Report | Daily Report | Daily Summary | Hourly Report | Hourly Summary | Domain Report | Organisation Report | Host Report | Status Code Report | File Size Report | File Type Report | Directory Report | Failure Report | Request Report)
This report lists the activity in each month.
Each unit ( ) represents 5 requests for pages or part thereof.
| month | reqs | pages | |
|---|---|---|---|
| Oct 2008 | 1900 | 201 |   |
Busiest month: Oct 2008 (201 requests for pages).
(Go To: Top | General Summary | Monthly Report | Weekly Report | Daily Report | Daily Summary | Hourly Report | Hourly Summary | Domain Report | Organisation Report | Host Report | Status Code Report | File Size Report | File Type Report | Directory Report | Failure Report | Request Report)
This report lists the activity in each week.
Each unit () represents 2 requests for pages or part thereof.
| week beg. | reqs | pages | |
|---|---|---|---|
| 28/Sep/08 | 22 | 15 | |
| 5/Oct/08 | 137 | 41 |   |
| 12/Oct/08 | 1377 | 59 |  |
| 19/Oct/08 | 232 | 41 | |
| 26/Oct/08 | 132 | 45 | |
Busiest week: week beginning 12/Oct/08 (59 requests for pages).
(Go To: Top | General Summary | Monthly Report | Weekly Report | Daily Report | Daily Summary | Hourly Report | Hourly Summary | Domain Report | Organisation Report | Host Report | Status Code Report | File Size Report | File Type Report | Directory Report | Failure Report | Request Report)
This report lists the activity in each day.
Each unit () represents 1 request for a page.
| date | reqs | pages | |
|---|---|---|---|
| 1/Oct/08 | 6 | 2 | |
| 2/Oct/08 | 11 | 8 | |
| 3/Oct/08 | 1 | 1 | |
| 4/Oct/08 | 4 | 4 | |
| 5/Oct/08 | 2 | 2 | |
| 6/Oct/08 | 4 | 4 | |
| 7/Oct/08 | 107 | 11 | |
| 8/Oct/08 | 7 | 7 | |
| 9/Oct/08 | 8 | 8 | |
| 10/Oct/08 | 7 | 7 | |
| 11/Oct/08 | 2 | 2 | |
| 12/Oct/08 | 3 | 3 | |
| 13/Oct/08 | 5 | 5 | |
| 14/Oct/08 | 4 | 4 | |
| 15/Oct/08 | 212 | 20 | |
| 16/Oct/08 | 396 | 15 | |
| 17/Oct/08 | 569 | 8 | |
| 18/Oct/08 | 188 | 4 | |
| 19/Oct/08 | 2 | 2 | |
| 20/Oct/08 | 12 | 9 | |
| 21/Oct/08 | 43 | 7 | |
| 22/Oct/08 | 147 | 10 | |
| 23/Oct/08 | 20 | 5 | |
| 24/Oct/08 | 5 | 5 | |
| 25/Oct/08 | 3 | 3 | |
| 26/Oct/08 | 1 | 1 | |
| 27/Oct/08 | 12 | 12 | |
| 28/Oct/08 | 4 | 4 | |
| 29/Oct/08 | 103 | 16 | |
| 30/Oct/08 | 9 | 9 | |
| 31/Oct/08 | 3 | 3 | |
Busiest day: 15/Oct/08 (20 requests for pages).
(Go To: Top | General Summary | Monthly Report | Weekly Report | Daily Report | Daily Summary | Hourly Report | Hourly Summary | Domain Report | Organisation Report | Host Report | Status Code Report | File Size Report | File Type Report | Directory Report | Failure Report | Request Report)
This report lists the total activity for each day of the week, summed over all the weeks in the report.
Each unit () represents 2 requests for pages or part thereof.
| day | reqs | pages | |
|---|---|---|---|
| Sun | 8 | 8 | |
| Mon | 33 | 30 | |
| Tue | 158 | 26 | |
| Wed | 475 | 55 | |
| Thu | 444 | 45 | |
| Fri | 585 | 24 | |
| Sat | 197 | 13 | |
(Go To: Top | General Summary | Monthly Report | Weekly Report | Daily Report | Daily Summary | Hourly Report | Hourly Summary | Domain Report | Organisation Report | Host Report | Status Code Report | File Size Report | File Type Report | Directory Report | Failure Report | Request Report)
This report lists the activity in each hour.
Each unit () represents 1 request for a page.
| time | reqs | pages | |
|---|---|---|---|
| 28/Oct/08 15:00–16:00 | 0 | 0 | |
| 28/Oct/08 16:00–17:00 | 0 | 0 | |
| 28/Oct/08 17:00–18:00 | 0 | 0 | |
| 28/Oct/08 18:00–19:00 | 0 | 0 | |
| 28/Oct/08 19:00–20:00 | 0 | 0 | |
| 28/Oct/08 20:00–21:00 | 0 | 0 | |
| 28/Oct/08 21:00–22:00 | 0 | 0 | |
| 28/Oct/08 22:00–23:00 | 0 | 0 | |
| 28/Oct/08 23:00–24:00 | 0 | 0 | |
| 29/Oct/08 00:00–01:00 | 0 | 0 | |
| 29/Oct/08 01:00–02:00 | 0 | 0 | |
| 29/Oct/08 02:00–03:00 | 0 | 0 | |
| 29/Oct/08 03:00–04:00 | 0 | 0 | |
| 29/Oct/08 04:00–05:00 | 0 | 0 | |
| 29/Oct/08 05:00–06:00 | 0 | 0 | |
| 29/Oct/08 06:00–07:00 | 0 | 0 | |
| 29/Oct/08 07:00–08:00 | 0 | 0 | |
| 29/Oct/08 08:00–09:00 | 0 | 0 | |
| 29/Oct/08 09:00–10:00 | 0 | 0 | |
| 29/Oct/08 10:00–11:00 | 4 | 3 | |
| 29/Oct/08 11:00–12:00 | 88 | 5 | |
| 29/Oct/08 12:00–13:00 | 1 | 1 | |
| 29/Oct/08 13:00–14:00 | 1 | 1 | |
| 29/Oct/08 14:00–15:00 | 0 | 0 | |
| 29/Oct/08 15:00–16:00 | 1 | 1 | |
| 29/Oct/08 16:00–17:00 | 4 | 1 | |
| 29/Oct/08 17:00–18:00 | 1 | 1 | |
| 29/Oct/08 18:00–19:00 | 0 | 0 | |
| 29/Oct/08 19:00–20:00 | 0 | 0 | |
| 29/Oct/08 20:00–21:00 | 3 | 3 | |
| 29/Oct/08 21:00–22:00 | 0 | 0 | |
| 29/Oct/08 22:00–23:00 | 0 | 0 | |
| 29/Oct/08 23:00–24:00 | 0 | 0 | |
| 30/Oct/08 00:00–01:00 | 0 | 0 | |
| 30/Oct/08 01:00–02:00 | 0 | 0 | |
| 30/Oct/08 02:00–03:00 | 0 | 0 | |
| 30/Oct/08 03:00–04:00 | 0 | 0 | |
| 30/Oct/08 04:00–05:00 | 0 | 0 | |
| 30/Oct/08 05:00–06:00 | 0 | 0 | |
| 30/Oct/08 06:00–07:00 | 0 | 0 | |
| 30/Oct/08 07:00–08:00 | 0 | 0 | |
| 30/Oct/08 08:00–09:00 | 0 | 0 | |
| 30/Oct/08 09:00–10:00 | 1 | 1 | |
| 30/Oct/08 10:00–11:00 | 1 | 1 | |
| 30/Oct/08 11:00–12:00 | 3 | 3 | |
| 30/Oct/08 12:00–13:00 | 0 | 0 | |
| 30/Oct/08 13:00–14:00 | 1 | 1 | |
| 30/Oct/08 14:00–15:00 | 2 | 2 | |
| 30/Oct/08 15:00–16:00 | 0 | 0 | |
| 30/Oct/08 16:00–17:00 | 0 | 0 | |
| 30/Oct/08 17:00–18:00 | 0 | 0 | |
| 30/Oct/08 18:00–19:00 | 0 | 0 | |
| 30/Oct/08 19:00–20:00 | 0 | 0 | |
| 30/Oct/08 20:00–21:00 | 0 | 0 | |
| 30/Oct/08 21:00–22:00 | 0 | 0 | |
| 30/Oct/08 22:00–23:00 | 1 | 1 | |
| 30/Oct/08 23:00–24:00 | 0 | 0 | |
| 31/Oct/08 00:00–01:00 | 0 | 0 | |
| 31/Oct/08 01:00–02:00 | 0 | 0 | |
| 31/Oct/08 02:00–03:00 | 0 | 0 | |
| 31/Oct/08 03:00–04:00 | 0 | 0 | |
| 31/Oct/08 04:00–05:00 | 0 | 0 | |
| 31/Oct/08 05:00–06:00 | 0 | 0 | |
| 31/Oct/08 06:00–07:00 | 0 | 0 | |
| 31/Oct/08 07:00–08:00 | 0 | 0 | |
| 31/Oct/08 08:00–09:00 | 0 | 0 | |
| 31/Oct/08 09:00–10:00 | 1 | 1 | |
| 31/Oct/08 10:00–11:00 | 0 | 0 | |
| 31/Oct/08 11:00–12:00 | 1 | 1 | |
| 31/Oct/08 12:00–13:00 | 0 | 0 | |
| 31/Oct/08 13:00–14:00 | 0 | 0 | |
| 31/Oct/08 14:00–15:00 | 1 | 1 | |
Busiest hour: 15/Oct/08 11:00–12:00 (18 requests for pages).
(Go To: Top | General Summary | Monthly Report | Weekly Report | Daily Report | Daily Summary | Hourly Report | Hourly Summary | Domain Report | Organisation Report | Host Report | Status Code Report | File Size Report | File Type Report | Directory Report | Failure Report | Request Report)
This report lists the total activity for each hour of the day, summed over all the days in the report.
Each unit () represents 2 requests for pages or part thereof.
| hour | reqs | pages | |
|---|---|---|---|
| 0 | 2 | 2 | |
| 1 | 1 | 1 | |
| 2 | 0 | 0 | |
| 3 | 0 | 0 | |
| 4 | 0 | 0 | |
| 5 | 0 | 0 | |
| 6 | 1 | 1 | |
| 7 | 1 | 1 | |
| 8 | 4 | 4 | |
| 9 | 302 | 11 | |
| 10 | 42 | 16 | |
| 11 | 611 | 63 | |
| 12 | 347 | 24 | |
| 13 | 90 | 7 | |
| 14 | 11 | 11 | |
| 15 | 134 | 10 | |
| 16 | 11 | 8 | |
| 17 | 10 | 7 | |
| 18 | 39 | 5 | |
| 19 | 88 | 4 | |
| 20 | 24 | 4 | |
| 21 | 96 | 4 | |
| 22 | 38 | 6 | |
| 23 | 48 | 12 | |
(Go To: Top | General Summary | Monthly Report | Weekly Report | Daily Report | Daily Summary | Hourly Report | Hourly Summary | Domain Report | Organisation Report | Host Report | Status Code Report | File Size Report | File Type Report | Directory Report | Failure Report | Request Report)
This report lists the countries of the computers which requested files.
Listing domains, sorted by the amount of traffic.
| reqs | %bytes | domain |
|---|---|---|
| 1900 | 100% | [unresolved numerical addresses] |
(Go To: Top | General Summary | Monthly Report | Weekly Report | Daily Report | Daily Summary | Hourly Report | Hourly Summary | Domain Report | Organisation Report | Host Report | Status Code Report | File Size Report | File Type Report | Directory Report | Failure Report | Request Report)
This report lists the organisations of the computers which requested files.
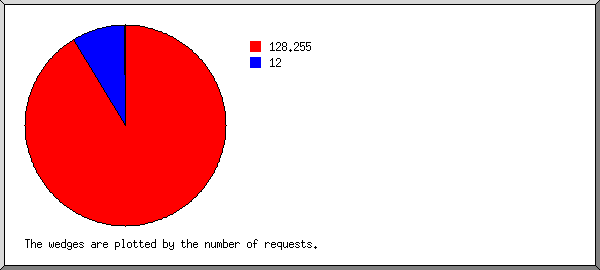
Listing organisations, sorted by the number of requests.
| reqs | %bytes | organisation |
|---|---|---|
| 1738 | 92.58% | 128.255 |
| 161 | 7.38% | 12 |
| 1 | 0.04% | 222.240 |
(Go To: Top | General Summary | Monthly Report | Weekly Report | Daily Report | Daily Summary | Hourly Report | Hourly Summary | Domain Report | Organisation Report | Host Report | Status Code Report | File Size Report | File Type Report | Directory Report | Failure Report | Request Report)
This report lists the computers which requested files.
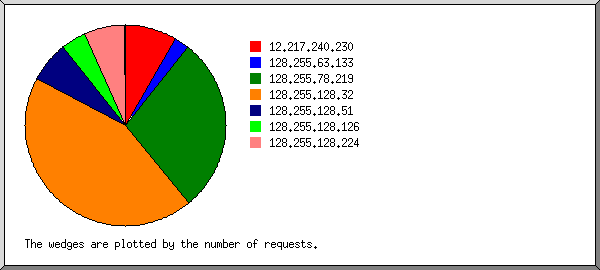
Listing hosts, sorted alphabetically.
| reqs | %bytes | host |
|---|---|---|
| 161 | 7.38% | 12.217.240.230 |
| 44 | 1.94% | 128.255.63.133 |
| 538 | 24.11% | 128.255.78.219 |
| 828 | 56.59% | 128.255.128.32 |
| 125 | 3.30% | 128.255.128.51 |
| 77 | 2.15% | 128.255.128.126 |
| 126 | 4.48% | 128.255.128.224 |
| 1 | 0.04% | 222.240.167.86 |
(Go To: Top | General Summary | Monthly Report | Weekly Report | Daily Report | Daily Summary | Hourly Report | Hourly Summary | Domain Report | Organisation Report | Host Report | Status Code Report | File Size Report | File Type Report | Directory Report | Failure Report | Request Report)
This report lists the HTTP status codes of all requests.
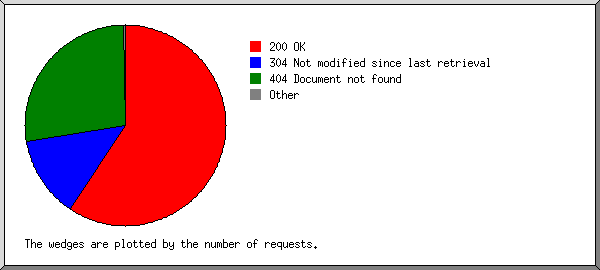
Listing status codes, sorted numerically.
| reqs | status code |
|---|---|
| 1551 | 200 OK |
| 349 | 304 Not modified since last retrieval |
| 5 | 403 Access forbidden |
| 718 | 404 Document not found |
(Go To: Top | General Summary | Monthly Report | Weekly Report | Daily Report | Daily Summary | Hourly Report | Hourly Summary | Domain Report | Organisation Report | Host Report | Status Code Report | File Size Report | File Type Report | Directory Report | Failure Report | Request Report)
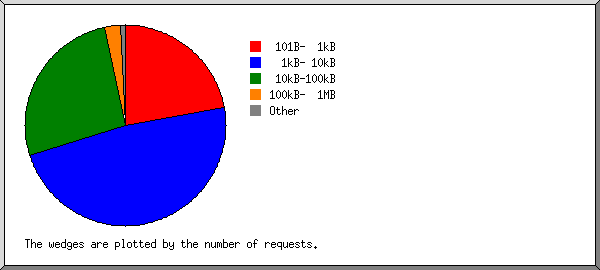
This report lists the sizes of files.
| size | reqs | %bytes |
|---|---|---|
| 0 | 13 | |
| 1B- 10B | 0 | |
| 11B- 100B | 0 | |
| 101B- 1kB | 423 | 0.42% |
| 1kB- 10kB | 908 | 14.35% |
| 10kB-100kB | 508 | 38.54% |
| 100kB- 1MB | 46 | 28.61% |
| 1MB- 10MB | 2 | 18.08% |
(Go To: Top | General Summary | Monthly Report | Weekly Report | Daily Report | Daily Summary | Hourly Report | Hourly Summary | Domain Report | Organisation Report | Host Report | Status Code Report | File Size Report | File Type Report | Directory Report | Failure Report | Request Report)
This report lists the extensions of files.
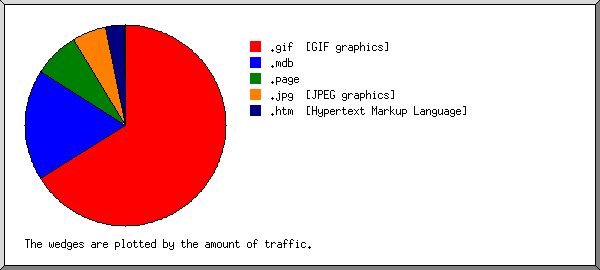
Listing extensions with at least 0.1% of the traffic, sorted by the amount of traffic.
| reqs | %bytes | extension |
|---|---|---|
| 1346 | 65.95% | .gif [GIF graphics] |
| 12 | 18.08% | .mdb |
| 300 | 7.29% | .page |
| 41 | 5.47% | .jpg [JPEG graphics] |
| 198 | 3.10% | .htm [Hypertext Markup Language] |
| 3 | 0.10% | [not listed: 2 extensions] |
(Go To: Top | General Summary | Monthly Report | Weekly Report | Daily Report | Daily Summary | Hourly Report | Hourly Summary | Domain Report | Organisation Report | Host Report | Status Code Report | File Size Report | File Type Report | Directory Report | Failure Report | Request Report)
This report lists the directories from which files were requested. (The figures for each directory include all of its subdirectories.)
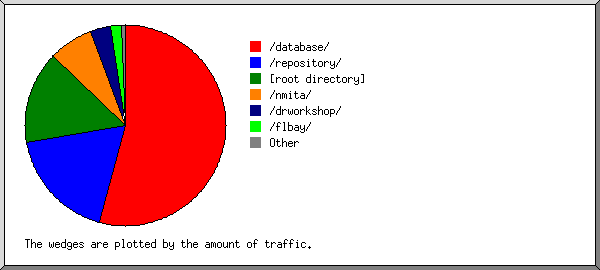
Listing directories with at least 0.01% of the traffic, sorted by the amount of traffic.
| reqs | %bytes | directory |
|---|---|---|
| 564 | 54.08% | /database/ |
| 18 | 18.14% | /repository/ |
| 982 | 14.97% | [root directory] |
| 296 | 7.24% | /nmita/ |
| 4 | 3.24% | /drworkshop/ |
| 35 | 1.84% | /flbay/ |
| 1 | 0.50% | /localities/ |
(Go To: Top | General Summary | Monthly Report | Weekly Report | Daily Report | Daily Summary | Hourly Report | Hourly Summary | Domain Report | Organisation Report | Host Report | Status Code Report | File Size Report | File Type Report | Directory Report | Failure Report | Request Report)
This report lists the files that caused failures, for example files not found.
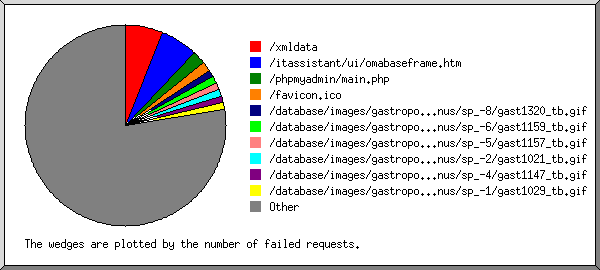
Listing the top 30 files by the number of failed requests, sorted by the number of failed requests.
| reqs | file |
|---|---|
| 44 | /xmldata |
| 44 | /xmldata?item=All |
| 44 | /itassistant/ui/omabaseframe.htm |
| 15 | /phpmyadmin/main.php |
| 12 | /favicon.ico |
| 8 | /database/images/gastropod/conidae/conus/conus/sp_-8/gast1320_tb.gif |
| 8 | /database/images/gastropod/conidae/conus/conus/sp_-6/gast1159_tb.gif |
| 8 | /database/images/gastropod/conidae/conus/conus/sp_-5/gast1157_tb.gif |
| 8 | /database/images/gastropod/conidae/conus/conus/sp_-2/gast1021_tb.gif |
| 8 | /database/images/gastropod/conidae/conus/conus/sp_-4/gast1147_tb.gif |
| 8 | /database/images/gastropod/conidae/conus/conus/sp_-1/gast1029_tb.gif |
| 8 | /database/images/gastropod/conidae/conus/conus/sp_-3/gast1141_tb.gif |
| 8 | /database/images/gastropod/conidae/conus/conus/sp_-7/gast1317_tb.gif |
| 7 | /phpmyadmin2/main.php |
| 7 | /pma/main.php |
| 7 | /admin/main.php |
| 6 | /mysql/main.php |
| 6 | /manager/html |
| 6 | /phpmyadmin-2.6.2-rc1/main.php |
| 6 | /user/soapcaller.bs |
| 6 | /phpmyadmin-2.6.3/main.php |
| 6 | /myadmin/main.php |
| 5 | /phpmyadmin-2.6.3-pl1/main.php |
| 5 | /phpmyadmin-2.5.6/main.php |
| 5 | /admin/phpmyadmin/main.php |
| 5 | /database/images/zooxanthellate_coral/acroporidae/acropora/acropora/sp_c/cor707_tb.gif |
| 5 | /intl/zh-cn/ |
| 5 | /phpmyadmin-2.2.3/main.php |
| 5 | /database/images/teleostei/atherinidae/atherinomorus/atherinomorus/stipes/atherinostip.gif |
| 5 | /database/images/zooxanthellate_coral/acroporidae/acropora/acropora/sp_y/cor709_tb.gif |
| 5 | /database/images/zooxanthellate_coral/acroporidae/acropora/acropora/sp_a/cor703_tb.gif |
| 442 | [not listed: 255 files] |
(Go To: Top | General Summary | Monthly Report | Weekly Report | Daily Report | Daily Summary | Hourly Report | Hourly Summary | Domain Report | Organisation Report | Host Report | Status Code Report | File Size Report | File Type Report | Directory Report | Failure Report | Request Report)
This report lists the files on the site.
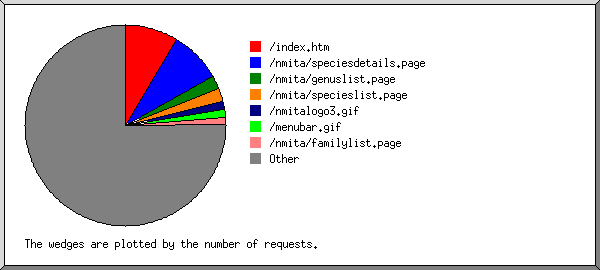
Listing files with at least 20 requests, sorted by the number of requests.
| reqs | %bytes | last time | file |
|---|---|---|---|
| 162 | 2.58% | 31/Oct/08 14:46 | /index.htm |
| 159 | 2.80% | 29/Oct/08 11:02 | /nmita/speciesdetails.page |
| 41 | 1.17% | 21/Oct/08 18:30 | /nmita/genuslist.page |
| 40 | 1.24% | 29/Oct/08 11:02 | /nmita/specieslist.page |
| 25 | 0.44% | 22/Oct/08 12:19 | /nmitalogo3.gif |
| 25 | 0.62% | 22/Oct/08 12:19 | /menubar.gif |
| 22 | 0.25% | 21/Oct/08 18:30 | /nmita/familylist.page |
| 10 | 0.14% | 21/Oct/08 18:30 | /nmita/familylist.page?classification=NMITA&taxonName=Zooxanthellate+Coral&getFamButton=Get+Families |
| 1426 | 90.90% | 29/Oct/08 16:51 | [not listed: 541 files] |